BUSINESS ANALYTICS
What you'll learn
- Learn Business Analytics with Python Master Python syntax, data manipulation, and key analytical techniques to drive data-driven business decisions and insights.
- Master Data Automation in Business Analytics Leverage Power BI, Tableau, SQL, and Advanced Excel for efficient data processing and insightful reporting.
- Use Functions and Modules in Business Analytics Enhance efficiency in Power BI, Tableau, SQL, and Excel by leveraging built-in functions, custom formulas, and modular data processing
- Work with Data Structures in Business Analytics Utilize tables, queries, pivot tables, and data models in Power BI, Tableau, SQL, and Excel for efficient data handling and analysis.
- Handle Data and Errors in Business Analytics Manage data imports, exports, and error handling in Power BI, Tableau, SQL, and Excel for seamless analysis and reporting.
Learning Objectives
- ADVANCE EXCEL
- SQL
- POWER BI
- TABLEAU
Course content
- 18 Modules
- 30 Sessions
- 2.5 Months Duration
NUMPY
Numpy Introduction, Numpy Arrays, Data Types in Numpy, Array Indexing, Array Slicing, Array Shape, Array Reshape, Array Iteration, Array Join, Array Split, Array Search & Sorting, Array Filter
PANDAS
Introduction Pandas, Series Pandas, Data Frames, Pandas Read CSV & JSON, Pandas Analyzing Data, Data Cleaning
MATPLOT
Introduction, Pyplot Plotting, Markers, Line Labels, Grid, Subplot, Scatter Plot, Bar Chart, Histogram, Pie Chart
ADVANCED EXCEL INTRODUCTION
FORMULAS & FUNCTIONS, Aggregate Function, Logical Function, Lookup & References, Financial Functions, Formatting and Proofing
CONDITIONAL FORMATTING
Conditional Formatting using New Rule Conditional Formatting using Formula
PIVOT TABLES
Creating Simple Pivot Tables, Classic Pivot table Basic and Advanced Value Field Setting, Calculated Field & Calculated Items, Grouping based on numbers and Dates
POWER PIVOT
Activating Power pivot Usage of Data model DAX Calculation Relational Data
SLICERS AND CHARTS
Using SLICERS, Filter data with Slicers Various Charts i.e. Bar Charts/Pie Charts/Line Charts Manage Primary and Secondary Axis
DATA AND VALIDATION
Number, Date & Time Validation Text and List Validation Custom Validation Dropdown List Validation.
ANALYZING AND ORGANIZING DATA
Creating Scenarios, Working with Data Tables, Using Goal Seek, Using Solver, Using Consolidating Data by Position or Category, Consolidating Data Using Formulas Excel
VBA MS ACCESS
Macro Builder, Create a standalone macro, Create an embedded macro, Add actions to a macro, Control program flow with If, Else If, and Else, Create sub macros, Group related actions together, Expand and collapse macro actions or blocks, Copy and paste macro actions, Share a macro with others
SQL INTRODUCTION
Get started with database, SQL and MySQL What is database? Why use SQL? Importance of MySQL
BASICS OF SQL
First Steps in SQL, Creating a database, Introduction to data types, Creating a table
INSTALLING SQL
Get acquainted with the interface
SQL SERVER LANGUAGES AND RELATIONAL DATABASES
DDL DCL DML TCL
RELATIONAL DATABASE TERMINOLOGY
Relational Database essentials, Primary key, Foreign key, Unique key and null values
THE SELECT STATEMENT
Load the database, Loading employees’ database, Starting with SELECT statement, Select-From Where And-Or (In-not in) Like-not like, Wildcard characters Between-and Is not null-is null, Select distinct, Aggregate statement, Order by-Group by Using Aliases, Having and Limit
SQL STATEMENT
Insert statement, Inserting data INTO table, Update statement, Commit and rollback, Delete statement, Drop vs Truncate, AGGREGATE FUNCTIONS, Functions Count Sum Min() and Max Avg Round()
POWER BI INTRODUCTION
What is Power BI, Why we have to use?
ARCHITECTURE
Components
SUPPORTED DATA SOURCES
Data Sources : Excel, SQL, CSV, JSON, Access
COMPARISON WITH OTHER BI TOOLS
Power BI vs Tableau
DATA MODELLING
Using Data Modeling and Navigation, Creating Calculated, Columns, Creating Calculated Tables, Managing Time-Based Data
DASHBOARD OPTIONS
Exploring Different Datasets, Creating and Sharing Dashboards, Tiles in Dashboard, Data Gateway
VISUALIZATION OPTIONS
Creating Simple Visualizations, Creating Map Visualizations, Using Combination Charts, Using Tables, Modify Colors in Charts, Adding Shapes, Images and Text box, Styling Reports, Duplicating Reports
EXCEL INTEGRATION
Using Excel Data Importing xlsx Files
DASHBOARDS
Using Power BI Desktop for Report Sharing, Printing Power BI Dashboards, Export Options, Publishing Report to Web, Using & Editing Content Pack
DAX BASICS IN POWER BI
DAX Architecture, Entity Sets DAX Data Types, Syntax Rules DAX Measures and Calculation Data Modeling Options in DAX
ADMINISTRATION ROLE
Purchasing REST API Security
TABLEAU INTRODUCTION
BI Concepts What is TABLEAU? Why Data Visualization? Unique Features compared to Traditional BI Tools TABLEAU Overview & Architecture File Types & Extensions
DATA CONNECTIONS IN TABLEAU INTERFACE
Data Connections in the Tableau Interface, Connecting to Tableau, Data Server, Types of Join, When to Use Joining, What is Data Blending, When to Use Data Blending, Joining vs. Blending, Creating Data Extracts in Tableau, Shadow Extracts, Prepare your Data for Analysis
ORGANIZING AND SIMPLIFYING DATA
Filters. Applying Filters Quick Filters Sorting of Data Creating Combined Fields Creating Groups and Defining Aliases Working with Sets and Combined Sets Drill to Other Levels in a Hierarchy Grand totals and Subtotals Tableau Bins Fixed Sized Bins Variable Sized Bins Creating and using Parameters Exploring Parameter Controls Using parameters for titles, field selections, logic statements, Top X Cross Tabs [Pivot Tables] Page Trials Total and Sub-Total
BUILDING CHART TYPES
Working with Combined Axis Working with Combination Charts Working with Geocoding and Geographic Mapping Using Scatter Plots Using Text tables and Highlight tables Using Heat Maps Using Histograms Using Pie Charts Using Bullet Charts
ADVANCED CHART TYPES
Using Pareto Charts Using Waterfall Charts Using Gantt Charts Using Box Plots Using Sparkline Charts Using Density Charts Using KPI Charts Small Multiples Working with aggregate versus disaggregate data What is Market Basket Analysis Performing Market Basket Analysis
LOGIC STATEMENTS
Formatting Options in Formatting Visualizations Working with Labels and Annotations Effective Use of Titles and Captions Introduction to Visual Best Practices
MAPPING
Importing and Modifying Custom Geocoding Working with Symbol Map and Filled Map Using Background Image Exploring Geographic Search Perform Pan Zoom Lasso and Radial Selection Working with WMS Server Maps [Web Map Service]
STATISTICS
Add Reference Lines Bands and Distribution Adding Reference Lines Adding Reference Bands Adding Reference Distribution Working Reference Lines Bands and Forecasting Trend lines and Trend Models
DASHBOARD
Build Interactive Dashboards Best practices for creating effective dashboards Creating a Dashboard and Importing Sheets Interaction Exploring Dashboard Actions Use of Running Actions & Dashboard Actions How to Share your Reports & Exporting your Work
Description
Become a Skilled Business Analyst with Industry-Leading Tools. This program covers essential to advanced business analytics techniques using Power BI, Tableau, SQL, and Excel. Learn data visualization, statistical analysis, and predictive modeling to extract insights and drive strategic decisions. Gain hands-on experience with real-world data, enhance your expertise, and boost your career in the evolving field of business analytics
Mapped Certificate

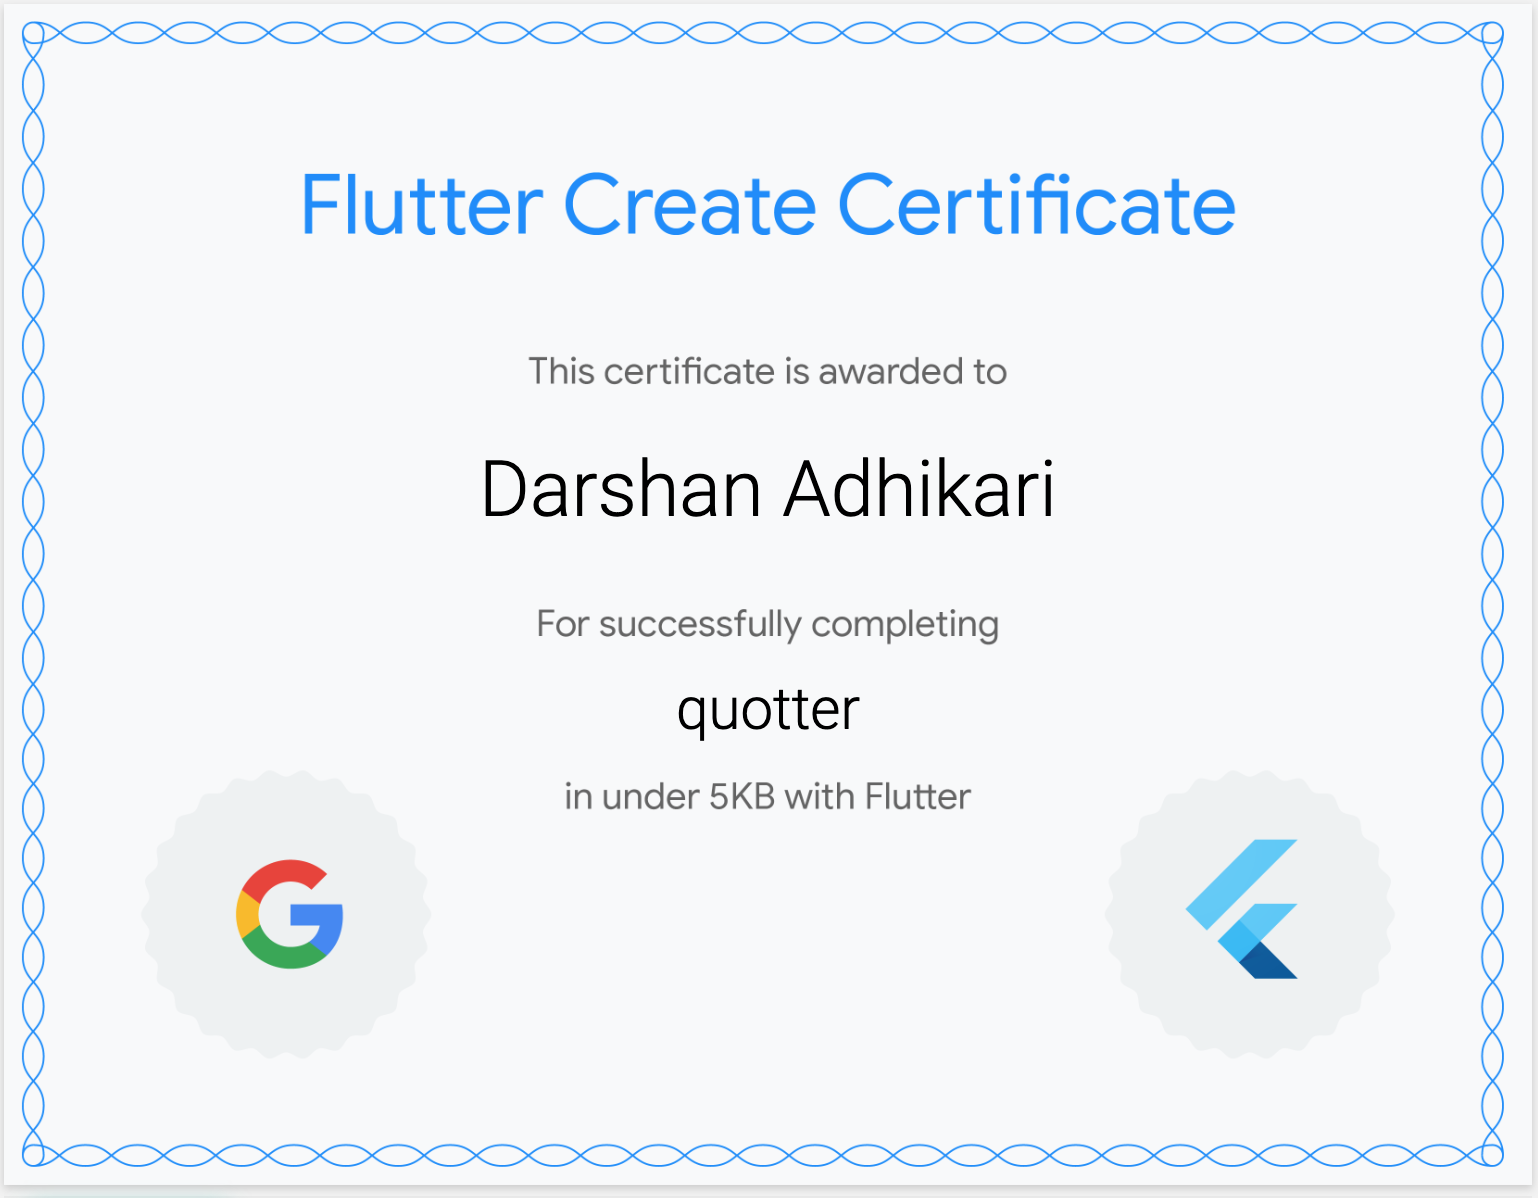
Google Flutter Certification
via Google Developer's Certification Program

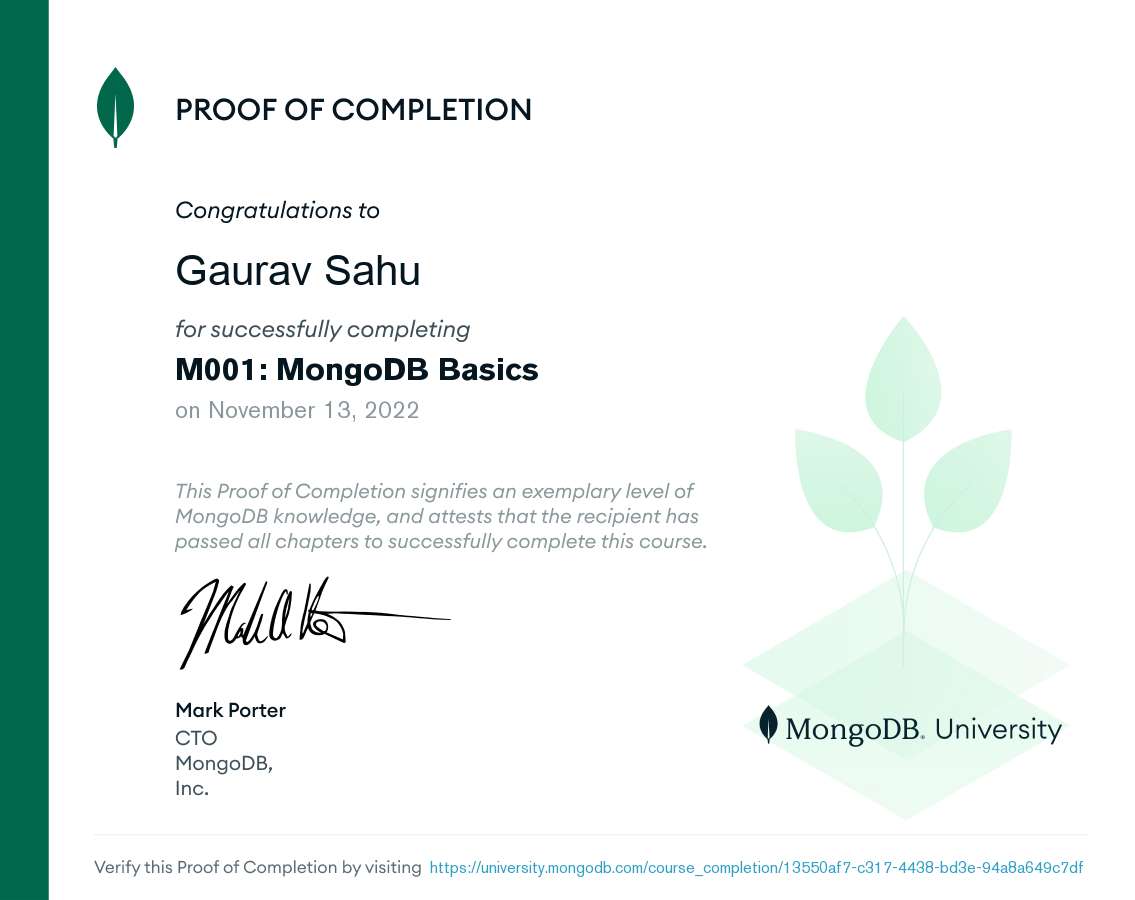
MongoDB University
For Flutter + Firebase integration
EXCELLENTTrustindex verifies that the original source of the review is Google. I am completed with python with data analytics course in IIE It's for good teaching best experience for placement training so I will like for Indra institute of education in Gandhipuram branch.Trustindex verifies that the original source of the review is Google. I have completed the data analytics course . The mentor was friendly to approach and they taught us all the concepts well and it was useful.Trustindex verifies that the original source of the review is Google. GoodTrustindex verifies that the original source of the review is Google. great place to study ccna ..sindhu mam really helped me a lot to finish my ccna courseTrustindex verifies that the original source of the review is Google. Successfully completed in networking and cloud course.thanks to iie teamsTrustindex verifies that the original source of the review is Google. Best institute in coimbatoreTrustindex verifies that the original source of the review is Google. Best training institute in coimbatoreTrustindex verifies that the original source of the review is Google. Best place to learn Data science and Machine Learning..Thanks IIE teamTrustindex verifies that the original source of the review is Google. Best place to learn data science in Coimbatore..Thanks IIE teamTrustindex verifies that the original source of the review is Google. I'm the student of indra institution in coimbatore. Here, to gave a well traning and good teaching of all students. Now , I'm placement to company. Thank you all
Lectures
15 Modules with Certificates
Duration
2.5 Months
Language
English, Tamil
Mode
Online, Offline
Learn Smarter, Not Hearder
Enjoyable Learning
Experience Awiat You
Our courses are taught by experienced professionals and subject matter experts who are passionate.
10,000
Daily Active Users
60%
Courses Enrollment Rate

4.7
Ratings
by 12 Learners
Frequently Asked Questions
Got Questions? We've Got Answers!
What is the Python course?
Lets find your Perfect online courses today!
Empower Yourself with Expert-Lead Learning Anytime, Anywhere


